->

21 July 2010

MapQuest Open (Beta) Using Open Street Map Data

MapQuest Open (Beta) Using Open Street Map Data
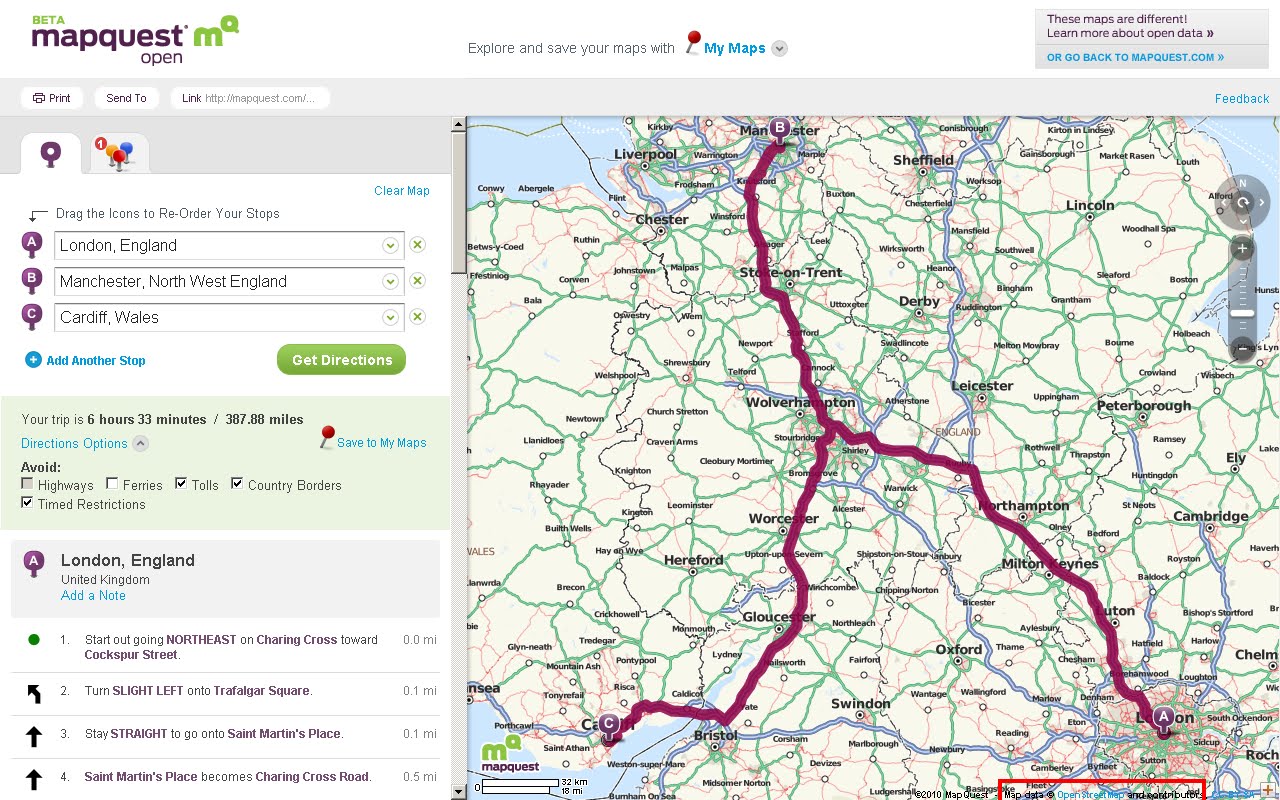

MapQuest Open Beta Open Street Map Data and Routes
MapQuest have over the past few months vastly improved the map user interface and are one of the first major mapping service to engage and encourage the use of Open Street Map Data with the new MapQuest Open mapping project.


"At the 4th annual international State of the Map 2010 conference, their plan to be the first major mapping site to embrace and encourage open source mapping at scale.  As part of this initiative, MapQuest just launched their first site that is completely powered by open source data from OpenStreetMap.org"


"This new project – open.mapquest.co.uk – was developed using the new MapQuest.com design but using data provided by the OpenStreetMap community.  The main difference between this new site and our existing MapQuest UK site is that the mapping and routing data was created, edited and enhanced by every day people like you.  OpenStreetMap was designed to give the local community the ability to update areas (roads, parks, hiking trails, bike paths, points of interest, etc) that they know in their own neighborhood and around the world, ultimately leading to what we believe will be the best and most accurate mapping experience for all.


AOL (owners of Mapquest) also announced a $1 million open-source mapping investment fund.  This fund will support the growth of open-source mapping in the United States in the local communities that Patch.com covers.  More information about the AOL grant application process is available by emailing osm@mapquest.com."


View the new Mapping Service - http://open.mapquest.co.uk/

More information - http://blog.mapquest.com/2010/07/09/mapquest-opens-up/
Well done to Mapquest for taking the challenge on and implementing a clean and easy to use mapping service.


Source:
http://www.openstreetmap.org/user/Harry%20Wood/diary/11288

Please give your feedback here http://mapquest.open-street-map.sgizmo.com/s3/

Labels: , , , ,

03 April 2010

ESRI Resource Centre - New

ESRI Resource Centre - New
or Center

ArcGIS 10 resource centre open

http://resources.arcgis.com/

ArcGIS 1o products included (intentionally?)

ArcGIS 10 includes a redesign of the ArcGIS Desktop interface and additional and improved functionality throughout the ArcGIS product line.

The following sections summarize changes in the software in different functional areas. Each section includes links to topics with more information for that specific area of the software.

Documentation

The resource centers and Support Web sites are merged into a single Web site and user experience.

Product documentation is reorganized and improved.

  • Over 75 percent of the help has been rewritten and updated.
  • Topics have been organized based on skill sets. The Essentials library contains core GIS concepts. The Professional library contains information about software functionality, how to use it, and more advanced GIS concepts.
  • The Administrator library contains information for people who install software, manage licensing, and administer servers and databases. The Developer library contains information for people who want to customize ArcGIS, create their own custom applications, or access data outside of ArcGIS clients.
  • Workflows and tutorials have been added to the ArcGIS installed and Web help.
  • The installed help files take up less space on your computer.
  • Videos have been added to the Web help.
example :
Mapping and visualization in ArcGIS Desktop

http://help.arcgis.com/en/arcgisdesktop/10.0/help/index.html# /Mapping_and_visualization_in_ArcGIS_Desktop/00660000042t000000/

Deeper Examples:
Exercise 1: Learning the fundamentals of representations
http://help.arcgis.com/en/arcgisdesktop/10.0/help/index.html#/Exercise_1_Learning_the_fundamentals_of_representations/008t00000073000000/

source:
http://geo.geek.nz/esri/redesigned-esri-support-centre-website-now-available/

and a surprise Overprinting is now supported!
(after 8 years of asking)

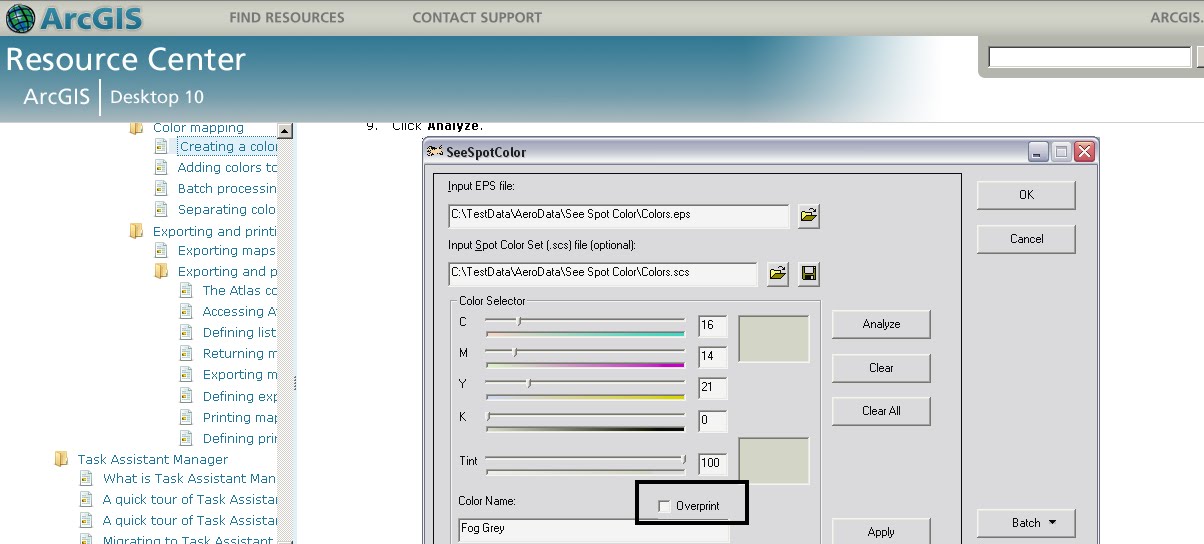
Spot Tool overprinting

ArcGIS 10 supports overprinting via the Spot Color tool. This allows you to create color-mapped .eps files for a series of map sheets that use the same set of colours.

Labels: , , , , , , ,

14 January 2010

Edmonton Opens Up City Data

Edmonton Opens Up City Data

The City of Edmonton in Alberta, Canada is following suit of Vancouver and Toronto and opening up city (public) data.

Data available now (more available after review of the community preview Feb 2010).
  • 2009 Census - Age and Gender
  • 2009 Census - Dwelling Unit Ownership
  • Bus Stops Edmonton Transit Locations
  • City Council Meeting Schedule
  • City Parks Locations of various City parks in Edmonton
  • Community League Centres Locations in Edmonton
  • Locations of all Fire stations in Edmonton
  • Locations of historical buildings in Edmonton
  • List of Planned Road Closures throughout the City of Edmonton
  • Police Stations Locations in Edmonton
  • Locations of School buildings in Edmonton

Though Edmonton take it a stage further and provide feeds and data overlay map ready so users can quickly make use of the data.

Edmonton Bing map
Default View of Bus Stops Overlay on the Edmonton City of Edmonton Website

Getting to the Data
Edmonton KML
This example show the direct feed http://datafeed.edmonton.ca/v1/coe/BusStops/ as a KML (Google Earth) file loaded directly on Google Maps.
To view this Data as above - http://maps.google.com/?q=http://datafeed.edmonton.ca/v1/coe/BusStops/?format=kml

There is a stage futher, not only do City of Edmonton provide Scripts ready made so it makes it much easier for non programmers to create their own web maps.
Edmonton bing map source
Default is Bing (Virtual Earth) Maps though drop-down Language Environment reveals Google Maps API source code.
Mapperz edited mashup
This a mapperz example taken from the code above. Though there are two important changes for the examples to work.
1. jquery-1.3.1.min.js needs to be fully mapped to your server/website
2.Google Maps API requires a specific API Key for YOUR site (API Key signup)

Other changes mapperz made are simply moving the latitude and longitude to centre on Edmonton and not Washington DC.

Links - and Well done to the City of Edmonton making this available.
http://data.edmonton.ca/

mapperz version (tweaked to work)
http://mapperz.googlepages.com/edmonton_google_map_source.html

source:
http://www.calgaryherald.com/Edmonton+releases+downloadable+databases/2438135/story.html

Labels: , , , , , , ,

01 January 2010

Met Office Data - Visualisation with Maps

Met Office Data - Visualisation with Maps

See the power and innovation of Opening up Government Data.
*in less than a month.

In late 2009 the UK Government launched an Open Data initiative, headed by Sir Tim Berners-Lee, along with a call for innovations challenging the developer community to make this data more accessible.

Geo.me Temperature Map
Geo.me Solutions is showcasing a number of concept demonstrations using map-based visualisations. Like the Temperature Map Above.

The Met Office might supply xml/rdf based data in the future.
But to get the raw data into a useable format Chris Wallace and assistance from Dave Challender make it available now.

Met Office Data Temperature Mashup
All the Met Offices data linked via xml to the stations data.

Background of the Data released last month by the Met Office
Land surface climate station records

The data down-loadable from this page are a subset of the full HadCRUT3 record of global temperatures, which is one of the global temperature records that have underpinned IPCC assessment reports and numerous scientific studies.

The data subset consists of a network of individual land stations that has been designated by the World Meteorological Organization for use in climate monitoring. The data show monthly average temperature values for over 1,500 land stations
http://www.metoffice.gov.uk/climatechange/science/monitoring/subsets.html


Now the Visualising of the data....

Met Office Temperature Mashup Chart
Temperature data that is interactive with the user temperature/timeline with a static map of the location.

Climate Data - An XML/XQuery implementation
Introduction

The UK Met Office recently released the temperature records for about 1600 stations world-wide. Each station record is available online as a text file, for example Stornoway.

"It is expected that longer-term, the MET office itself will make the data available in more readily programmable format. In the meantime, this site offers a number of XML-based resources for access to the data."

The station data and temperature record is available in two forms:


Source
http://www.cems.uwe.ac.uk/xmlwiki/Climate/index.html
http://labs.geo.me/climate_trends

So UK Government opening up the data will encourage innovation and business - so get on with open up the data - by April 2010 (please).

Labels: , , , , , ,