Met Office Data - Visualisation with Maps
See the power and
innovation of Opening up Government Data.
*in less than a month.
In late 2009 the UK Government launched an Open Data initiative, headed by
Sir Tim Berners-Lee, along with a call for innovations challenging the developer community to make this data more accessible.
 Geo.me
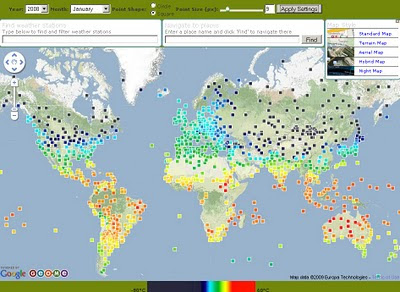
 Solutions is showcasing a number of concept demonstrations using map-based visualisations. Like the Temperature Map Above.
The Met Office might supply xml/rdf based data in the future.
But to get the raw data into a useable format Chris Wallace and assistance from Dave Challender make it available now.

All the Met Offices data linked via xml to the stations data.
Background of the Data released last month by the Met Office
Land surface climate station records
The data down-loadable from this page are a subset of the full HadCRUT3 record of global temperatures, which is one of the global temperature records that have underpinned IPCC assessment reports and numerous scientific studies.
The data subset consists of a network of individual land stations that has been designated by the World Meteorological Organization for use in climate monitoring. The data show monthly average temperature values for over 1,500 land stations
http://www.metoffice.gov.uk/climatechange/science/monitoring/subsets.htmlNow the Visualising of the data....

Temperature data that is interactive with the user temperature/timeline with a static map of the location.
Climate Data - An XML/XQuery implementation
Introduction
The UK Met Office recently released the temperature records for about 1600 stations world-wide. Each station record is available online as a text file, for example Stornoway.
"It is expected that longer-term, the MET office itself will make the data available in more readily programmable format. In the meantime, this site offers a number of XML-based resources for access to the data."The station data and temperature record is available in two forms:
Source
http://www.cems.uwe.ac.uk/xmlwiki/Climate/index.htmlhttp://labs.geo.me/climate_trendsSo UK Government opening up the data will encourage innovation and business - so get on with open up the data - by April 2010 (please).
Labels: 2.0 Maps, API, Data, Geo.me, Open, The Met Office, Visualisation





