->

22 July 2011

Met Office - Storm Tracker Beta

Met Office - Storm Tracker Beta

Met Office Storm Tracker

The Met Office has created a new Google Maps Flash Map to monitor and forecast tropical storms around the world.

There are two versions of this map - Free and Premium (Paid For)

Free Version
· 1 x forecast weather layer (UK deterministic 5 day storm track)
· 1 x observed track
· 3 x latest weather layers:
· cloud (IR and Visible satellite)
· sea surface temperatures
· Thousands of historic storms (HURDAT data from 1850 until the present).

Advanced version (paid for service)
Additional premium content for an advanced service is available at a subscription rate.
The advanced service includes access to all the above, plus:
· Probabilistic forecasts of storms and weather – so a range of possible scenarios
can be understood
· Met Office 15 day ensemble forecast storm tracks; and equivalent data from
European Centre for Medium-range Weather Forecasting (ECMWF) and USA’s
National Oceanic and Atmospheric Administration (NOAA).
· Multi-model combinations of these leading models

· Additional forecasts for storms, including strike probabilities, forming storms, and
ensemble mean storm tracks
· A utilities layer showing district boundaries for the Gulf of Mexico
Access to these features enables users to build a far more complete picture

Users require to have an account (even for the free version) worldwide cloud conditions and the locations of current cyclones. If you select a cyclone on the map you can view the cyclone's observed track and wind speeds recorded along the track.

As well as viewing current tropical storm conditions it is also possible to view historical storm information. For example you can view the track of the 2009 Hurricane Bill.


Met Office Storm Tracker Historic Tracks


Storm Tracker Worldwide Map by the UK Met Office.
http://www.metoffice.gov.uk/premium/stormtracker/
(sign up and login required to view both free and premium)

Source:
http://googlemapsmania.blogspot.com/2011/07/worldwide-tropical-storm-tracker.html

Labels: , , , , , ,

23 June 2010

Met Office Events Weather Maps

Met Office Events Weather Maps

Whether your interested in The World Cup in South Africa, Wimbledon Tennis Championships or the Music at the Glastonbury Festival the Met Office has released weather map events.

Met Office Weather Events Glastonbury Map
Check out the Glastonbury Temperature, UV, Pollen Forescast weather is continously updated to provide you with warning (Thunderstorms, high ultraviolet rays and hopefully sun.)

Met Office Weather Events Wimbledon UV Map
See UV Sun Index guidance with the interactive symbols on the Wimbledon Weather Map


"The World Cup finals will, for the first time, be taking place in Africa, with South Africa playing the host nation for what is regarded as the world's largest sporting spectacular.

The tournament is taking place between 11 June 2010 and 11 July 2010.

The Met Office are providing a weather forecast for the venues of the World Cup finals, click on the weather symbols on the map to get more detailed information on the venue of interest. "

Met Office Weather Events World Cup Map
Looks like Sunny all the way in South Africa for the World Cup 2010.

Map Links
http://www.metoffice.gov.uk/public/pws/events/worldcup/
http://www.metoffice.gov.uk/weather/uk/wimbledon.html
http://www.metoffice.gov.uk/weather/uk/glastonbury.html

Source:
http://www.metoffice.gov.uk/public/pws/events/

update: 24th June 2010
Met Office News - Press Release on these Events
http://www.metoffice.gov.uk/corporate/pressoffice/2010/pr20100624.html

Labels: , , , , , , ,

01 January 2010

Met Office Data - Visualisation with Maps

Met Office Data - Visualisation with Maps

See the power and innovation of Opening up Government Data.
*in less than a month.

In late 2009 the UK Government launched an Open Data initiative, headed by Sir Tim Berners-Lee, along with a call for innovations challenging the developer community to make this data more accessible.

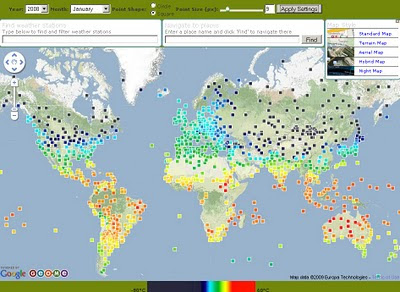
Geo.me Temperature Map
Geo.me Solutions is showcasing a number of concept demonstrations using map-based visualisations. Like the Temperature Map Above.

The Met Office might supply xml/rdf based data in the future.
But to get the raw data into a useable format Chris Wallace and assistance from Dave Challender make it available now.

Met Office Data Temperature Mashup
All the Met Offices data linked via xml to the stations data.

Background of the Data released last month by the Met Office
Land surface climate station records

The data down-loadable from this page are a subset of the full HadCRUT3 record of global temperatures, which is one of the global temperature records that have underpinned IPCC assessment reports and numerous scientific studies.

The data subset consists of a network of individual land stations that has been designated by the World Meteorological Organization for use in climate monitoring. The data show monthly average temperature values for over 1,500 land stations
http://www.metoffice.gov.uk/climatechange/science/monitoring/subsets.html


Now the Visualising of the data....

Met Office Temperature Mashup Chart
Temperature data that is interactive with the user temperature/timeline with a static map of the location.

Climate Data - An XML/XQuery implementation
Introduction

The UK Met Office recently released the temperature records for about 1600 stations world-wide. Each station record is available online as a text file, for example Stornoway.

"It is expected that longer-term, the MET office itself will make the data available in more readily programmable format. In the meantime, this site offers a number of XML-based resources for access to the data."

The station data and temperature record is available in two forms:


Source
http://www.cems.uwe.ac.uk/xmlwiki/Climate/index.html
http://labs.geo.me/climate_trends

So UK Government opening up the data will encourage innovation and business - so get on with open up the data - by April 2010 (please).

Labels: , , , , , ,

27 October 2009

The Met Office Weather Maps - October 2009 update

The Met Office Weather Maps - October 2009 update

The biggest difference is speed, layers of weather data have improved and load even faster.

Faster Met Office Radar Rainfall Map

The rainfall layer shows you a radar image of rain across the country. The different colours show different intensities of rain, from dark blue (least severe rain) to white (most severe).

Faster radar and coverage expanded users will find the 'Tools' easier to control opacity (even in timeline mode).

Timeline: (animated weather in time lapse)

The timeline has been improved due to the layers speed, one of the most important parts of the weather map. By clicking on timeline, you can see recent observations or forecast weather.

The weather that is being displayed on the map has its date and time shown on the timeline, and its segment is highlighted in green.

Note that segments on the left-hand side (weather already happened) have a grey bottom. Segments on the right (which show show weather forecasts) have a green bottom.

As your mouse moves over each segment, you will see the date and time of the information, shown in light blue. Click the segment to display the weather you're hovering over.

With some options, there is a play button shown next to the timeline. Clicking it will step through the information one segment at a time. This can be very useful to see how rainfall or cloud is moving across your area. Click the pause button to stop the animation.

Layers that can't be animated show a play button with a red line through it.

The locations box now allows you to store up to 8 places, for quick navigation to those points on the map.

Faster Met Office Pressure Map
The pressure layer now shows text and lines called isobars. Each isobar connects points that have the same atmospheric pressure.

Faster Met Office Temperature Map
Require imperial measurements?, then they are available in preferences.
Welsh is in the pipeline but not available currently.

Faster Met Office National Parks Maps Weather Warnings
National Parks (Leisure areas) have now got there own unique weather warnings, specifically to highlight Blizzards, Heavy snow, Storm force winds,Gales, Severe chill effect, Persistent extensive hill fog, Thunderstorms and Heavy persistent rain.

See previous posts on this topic versions
http://mapperz.blogspot.com/2009/06/met-office-google-maps-weather.html

http://mapperz.blogspot.com/2009/07/best-uk-google-map-api-mashup-ever.html
(note suggestions have been picked up on)

Labels: , , , , ,

16 July 2009

The Best UK Google Map API Mashup Ever?

The Best UK Google Map API Mashup Ever?

update 20th July 2009
This is now back up and running as you see it here on the blog. The Met Office reverted the code last week after this blog post
http://www.metoffice.gov.uk/invent/pwsviewer/


There was a sneak peak of this a few weeks ago, but the update to this is truly amazing.
This has the 'super wow' factor.

Full Credit to the Met Office on this and picking up on feedback from webs users and readers of this Mapperz Blog

Met Office - Current Weather
The Current Weather Outlook over the UK with nice clean self-explanatory icons.

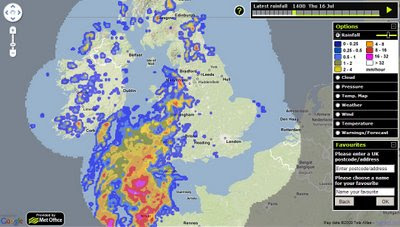
Met Office - Rainfall Radar Weather
Full Radar Coverage of Current Rainfall and works smoothly in animated 'play' mode.

Met Office - Temperature Map Weather
Now with the Mapperz most requested overlay - temperature - users can use the slider on the legend to adjust the opacity (transparency) of the overlay.

Met Office - Wind and Direction Map Weather
Wind speed and directions now available - clear icons with more information on hovering over the icons.


Met Office - Weather Warnings Map title=
Weather Warnings illustrated by counties across the UK

The Met Office Weather Map- Enjoy!
http://www.metoffice.gov.uk/invent/pwsviewer/
17/07/2009
update Bad Weather stops play.
"reverted until we get over this weekend's severe weather event."
so come back next week.
Well done too all involved a great service just got better (Next week).
(special thanks to @angerelle)

Note Firefox users with FireBug might experience the no map issue - either disable firebug or use another browser to view this map, its worth it for the experience.
(this is fixed!)

Related Post
http://mapperz.blogspot.com/2009/06/met-office-google-maps-weather.html

Follow Mapperz on Twitter

Labels: , , , , , , ,

30 June 2009

The Met Office (Google Maps) Weather

The Met Office (Google Maps) Weather

The Met office are experimenting with the Google Maps API - this is a very interesting move. The results are quite impressive and this is a potentially a bold move and a great way to represent weather forecasting on the web.
This includes animating the weather for the next 24hrs using the time bar above the map.

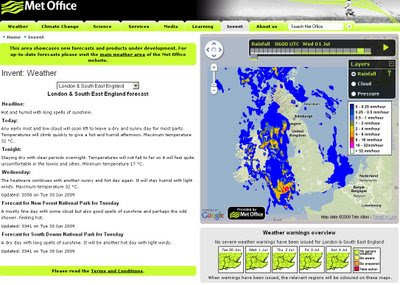
The Met Office Weather using Google Maps 1st July
Google Maps API with Meteorological Data overlayed to represent very visually the foretasted weather for the UK. Animation is controlled by the 'Play' Button.

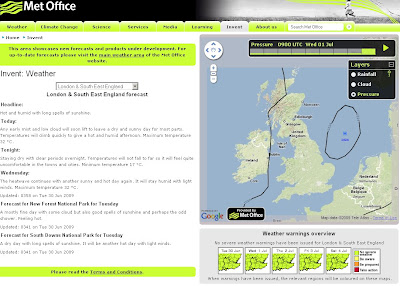
Not only is rainfall overlayed but isobars representing the pressure is also animated.

The Met Office Weather using Google Maps Isobars
Isobars (Barometric Pressure) overlay on Google Maps

There is Temperature, Winds(strength/direction) missing currently, this is planned for the future and will be very useful for users.

This is an impressive experiment and greatly improves the very static generated images that currently dominated the Met Office Website.

Well done to all involved, this is what the public want.

The Met Office Google Map (Experimental)

Currently the BBC have Temperature and Winds [Flash required]
http://news.bbc.co.uk/weather/forecast/10209

Suggestions - Opacity Control - current radar blocks the background map.
Temperature and Winds layers would be very handy.
5 day forecast possible?
An a final request on the raw data - it possible to have a basic GeoRSS feed for budding developers to create weather overlays for their own maps
GeoRSS weather warnings?

Labels: , , , , , ,