->

12 August 2009

BBC Crime Map - Truth About Crime

BBC Crime Map - Truth About Crime

"A unique experiment uncovering crime in a typical British city"

The BBC have chosen Oxford, England because it is as close as they could find to a typical British city. In terms of demographics, and particularly in terms of levels and types of crimes, it is typical of the national picture.
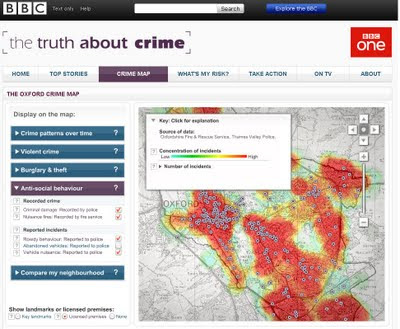
Truth About Crime BBC Heat Map
Heat maps with 'licenced' premises

In making this website and the accompanying television series the BBC worked closely with Thames Valley Police. Oxfordshire Fire & Rescue Service, Oxfordshire County Council Trading Standards Department, Oxfordshire Domestic Abuse Services, South Central Ambulance Service, the John Radcliffe Hospital, and Oxford's Crime & Disorder Reduction Partnership, who supplied the BBC with the original data.

Data Currency:
The data covers the year from November 2007 to November 2008

Why Heatmaps?
'heatmaps' are used to display the crime data, since these offer a clear way for users to see patterns of crime, without requiring users to have the expert knowledge of crime data analysts.

Want to create your own heatmap?
Try - http://www.heatmapapi.com/

View the BBC Heat Map for Oxford
http://www.bbc.co.uk/truthaboutcrime/crimemap/
Labels: , , , , ,

11 June 2009

Google Fusion Tables [Fast Batch Geocoding]

Google Fusion Tables [Fast Batch Geocoding]

"A fast an effective way to batch geocode spreadsheet data."

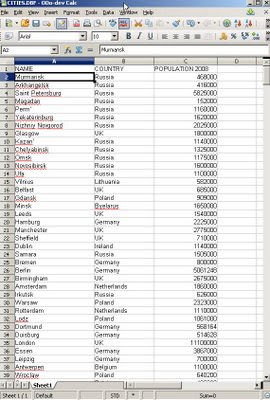
World Cities Population in Open Office
Take some data, with no geographic information. Upload to the New Google Fusion Tables and Map it.

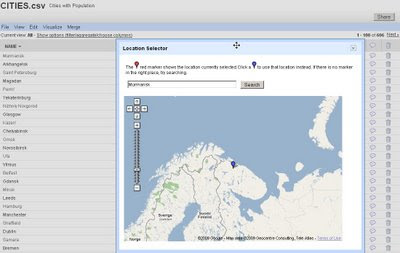
Some spot checking of data in location - as geocoding is not an exact science.
World Cities with population checking locations

Simply import the data will then give you access to 'Map' the data.

Automatic Batch Geocoding
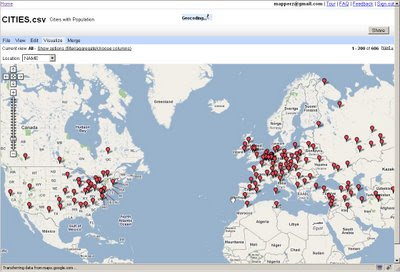
Then the real magic of automatic batch geocoding on the fly - you can visually see the data being placed on the map.
All within a few seconds - then whole process takes less than 30 seconds [based on 606 cities] though only 1-200 markers are display at one time.

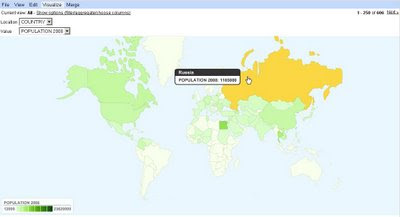
And to finish it off - it is easy to create a simple thematic map.Population Summary Thematic Map

Suggestions, would be nice to be able to overlay the thematic map [based in flash] over the Google Map (or creating gpolygons).
Sharing with the option of embedding and link to would be convenient.
*Note currently in Google Labs things will change.

A nice tool with great potential has unique features and powerful visualization functions.

Summary
Google Chart meets Google Maps with Google Spreadsheets binding them.

Related
http://googlemapsmania.blogspot.com/2009/06/
google-fusion-tables-google-maps.html

Official Post
http://googleresearch.blogspot.com/2009/06/google-fusion-tables.html

Labels: , , , , , , , ,

29 May 2009

Up2Maps Thematic Maps Editor

Up2Maps Thematic Maps Editor

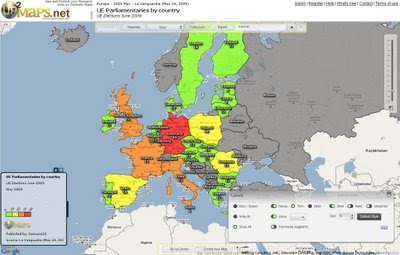
Up2Maps Europe - using Google Maps Flash API
Create Thematic Maps Fast with Up2Maps

Feature List
:
  • Maps can be exported to image (png) or embedded in blogs.
  • Data can be uploaded in excel files or typed directly in the application.
  • There are 2 levels of detail for each country.
  • Runs on Google Maps Flash API
  • Data includes territory names, zip/postal codes and international codification like FIPS and ISO.
Up2Maps Europe Editor
Map Editor - Build your own Thematic Map - Maps can be edited in many ways (colors, labels, legend etc)

Thanks to Moisés García
http://www.up2maps.net/

Ready Made Map EU Parliamentaries by Country
http://www.up2maps.net/maps/Gamusin23/Europe/ue_parliamentaries_by_country.html

Labels: , , , ,

20 March 2008

Google Chart API - Maps New!

Quick update:
Overlaying Google Charts in Google Map (Via KML GeoXML Overlay)
http://mapperz.googlepages.com/chart_overlay.html

Google Charts API - Maps
New!

The Google Chart API lets you dynamically generate charts on the fly.


Google Chart API now generates thematic Maps.

From the Google Chart API Group:

"We released a new version of the Google Chart API. It adds many new features that you requested here in this group, for example sparklines, radar charts and thematic maps.

The most important change however is that we removed the limit on the number of requests. This means you can use the Google Chart API without worrying about reaching a limit.

For the documentation about the new features and usage policy please see the updated documentation page: "
http://code.google.com/apis/chart/

The example Chart API Map (above) can be generated with this url.
http://chart.apis.google.com/chart?cht=t&chs=440x220&chd=s:_&chtm=europe&chld=GB&chco=ffffff,edf0d4,13390a%20=GBFR&chd=s:Af9&chf=bg,s,EAF7FE

This would be good if you could overlay kml...
or overlay pie charts (or any other) onto a Google Map.

Other changes to the Chart API
  • Text encoding with data scaling New!
  • Bar chart zero line New!
  • Radar charts New!
  • Sparklines New!
  • Solid fill Extended!
  • Line styles Extended!
  • Shape and range markers Extended!
  • Required and optional parameters Extended!
  • Usage policy Extended!

Labels: , , , , ,

04 December 2006

Thematic Google Map Creator

University College London (UCL) has been very busy and using their resources have made an excellent thematic mapping package for overlaying on google maps.

UCL - London Thematic Mapping on Google Map

The Google Map Creator is a freeware application designed to make thematic mapping using Google Maps simpler. The application takes a shapefile containing geographic areas linked with attributes and automatically generates a working Google Maps website from the data. It does this by pre-creating all the necessary files and saving them into a directory. Publishing the map on the web is then just a matter of copying files onto a web server, allowing Google Maps to be used with the majority of ISPs, including Google Pages.

UCL - World Thematic Mapping on Google Map


"How It Works?
A shapefile is loaded into the application and displayed on the screen. A projection file (.prj) MUST be included with the shapefile, otherwise the data cannot be placed in the correct position over the Google Map. This file is easily created externally if needed. The displayed attribute, colouring of the data, geographic extents and maximum zoom levels are defined by the user. Colouring is achieved by setting colours and thresholds for values in the attribute data e.g. any region over 1.0 is red. The application shows how many tiles will be created, which can be changed by altering the maximum zoom level slider or by limiting the geographic area. When the create button is pressed, the result is an html page and a directory containing all the required Google Maps tiles. As all the tiles are pre-created, all that is required to publish the map on the web is to copy the html page and the tile directory onto a web server, making sure that the Google Maps API key contained in the html file is correct for the site. This allows the publishing of data on 'Google Pages' or any other ISP. The html file is created from a template, but only a limited knowledge of Javascript and html is required to create a completely new design from scratch. This can be done by cutting and pasting from the automatically created template.

The main problem with creating Google Maps sites in this way is that the number of tiles can be very large. The application manages this problem by allowing the user to control the maximum level of zoom and the extents of the geographic area. For example, with a map of worldwide Gross Domestic Product by country, there is no point in zooming in beyond the point where one country fills the whole screen, so the maximum level of zoom is limited and the number of tiles kept within a manageable level. In this example, six zoom levels are adequate for the data, resulting in 962 files occupying 5MB on the disk. At the other end of the scale is data from a GPS tracked carbon monoxide sensor used within a 1KM grid square in London. In this case, the maximum zoom level is used to show the 5 metre data grid, but only 71 files (less than 1MB) were created as the geographic area is so limited. "

Download available from the UCL website


Excellent Work UCL - Mapperz

Labels: , , ,