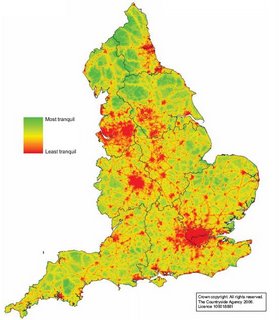
Peaceful England - Tranquillity Map
A Tranquillity Map of England...

Urban Sprawl vs Peaceful Rural Countryside
"It has become harder to experience tranquillity over the past few decades – and may get harder still. Tranquillity is threatened by the steadily increasing urbanised area, the development of the road network, the growth in road and air traffic and the expansion of energy infrastructure. "
England Regions available in PDF format on the Campaign to Protect Rural England (CPRE)
Source: BBC News
4 Comments:
Bad Map- Houw can you just deduce that poulation density translates to some tranquility value. This is just an advertisement> the proper title for this map would be Population density.
I understand what you're saying, Brian, but I don't completely agree with you. There's a lot of low population density areas with high levels of noise, like roads and highways or airports, and you can notice some of them on the map, so I don't think this is a population density map. It's true that not every high population density area is unpeaceful, but regarding the criteria of this study (it's a nationwide survey to test what tranquillity means to people: things like hearing birdsong, seeing a natural landscape or seeing the stars at night; and not seeing roads, power lines or lots of people), you can see that the map is accurate. So I think maybe you disagree with the survey responses, not with the map.
Based off of survey responses, that I didn't catch. Then fine I guess this is a Trainquility map. But if this map was derived from an analysis of existing layers (population, transportation) than it would have just been an asumption of where trainquility exits. That is what I belived was happening.
Methodlody using GIS
500m pixel grid model of England, giving each pixel a value based on the weighted overlay of data layers..
• Land Cover
• Proximity of rivers, streams, lakes and the sea;
• Presence of birds and other wildlife;
• Proximity to transport links
• Proximity to urban settlements
• Population density
• Presence of visually intrustive features such as pylons and wind turbines
Post a Comment
<< Home